Data Goat Project Documentation
This documentation provides detailed information about Data Goat's features, functionalities, and how to leverage its capabilities to track and analyze essential metrics.
Introduction and Overview
Data Goat is a comprehensive analytics tool tailored specifically for Webflow users, accessible directly within Webflow Designer.
It adheres to Webflow's low-code/no-code principles, making it user-friendly and accessible to various technical and non-technical users. It’s intended for a spectrum of Webflwo users: developers, designers, marketers, agencies, or companies.
As a Webflow Designer plugin, Data Goat operates entirely within the Webflow environment, eliminating the need to navigate external platforms. This allows quick access, setup, and usage without disrupting your workflow.
Data Goat is a valuable tool for Webflow users who seek to better understand their website's performance and optimize their content to engage their audience effectively. By providing in-depth analytics and custom reports, Data Goat empowers users to make data-driven decisions without leaving the Webflow Designer ecosystem.
The four major features of Data Goat include:
- Integration with GA4 – Data Goat seamlessly connects Webflow sites with Google Analytics 4 (GA4), enabling users to gather valuable insights into user behavior, traffic sources, and demographics.
- Track important metrics – With Data Goat, users can monitor essential metrics such as outbound link clicks, site clicks, form submissions, post types, and custom events.
- Custom reports – Data Goat offers custom report creation, refining raw data to provide users with relevant analyses tailored to their specific websites and visitors.
- Page-level tracking – Data Goat tracks each page of your website individually, but it is possible to switch to website-level tracking.
Getting Started: How to Set Up Data Goat with Webflow
New users need to use the following process:
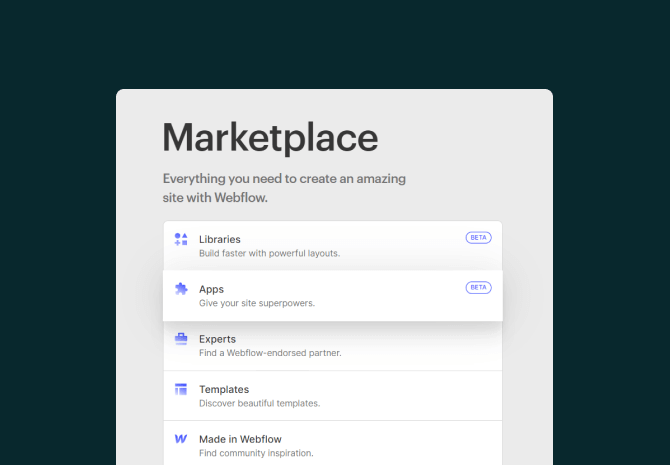
- Step 1: Install the application from the Webflow Marketplace – Find the app manually under Apps → Analytics.
- Step 2: Select the project where you want to run it – After clicking the Install button, you will be prompted to select the projects that you want to use Data Goat with.
- Step 3: Webflow redirects you to Datagoat – Webflow will automatically redirect you to the Data Goat website, where the registration process will start.
- Step 4: Create an account and enter your payment method (or log in if you already have an account) – Go through the registration process and provide the necessary information to complete signing up. You will also have to connect a payment method in this step.
- Step 5: Click on the button to connect with Google Analytics – Once you log in to the app, click on the option to authorize Google and connect Google Analytics with your Data Goat. This will make it possible for Data Goat to use data collected by GA.
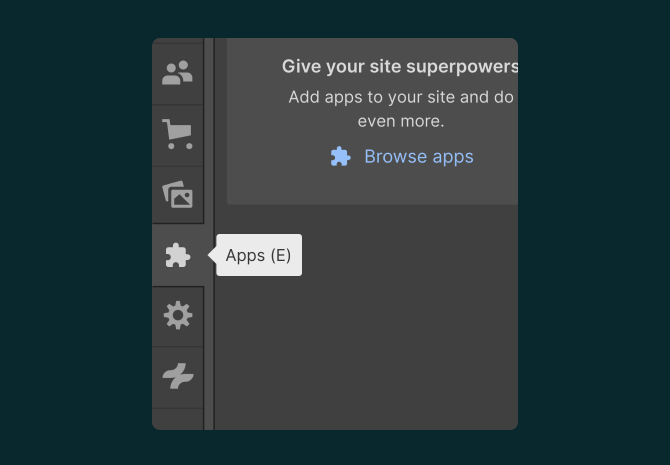
- Step 6: Open the project in Webflow Designer and click on Apps in the sidebar — This will open the search bar where you need to find Data Goat.
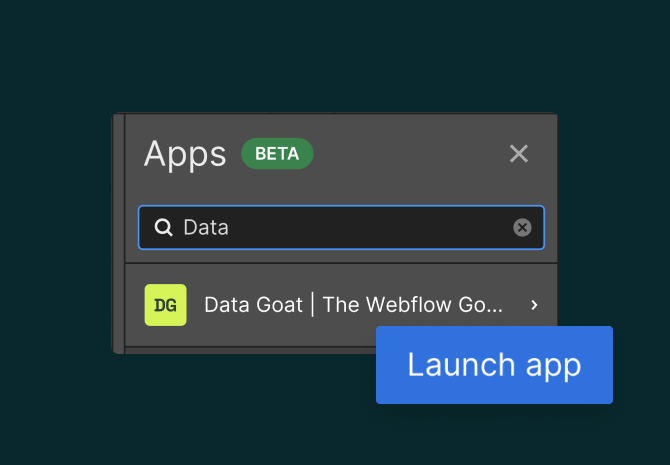
- Step 7: Find the Datagoat app and launch it — Click on the blue Launch app button.
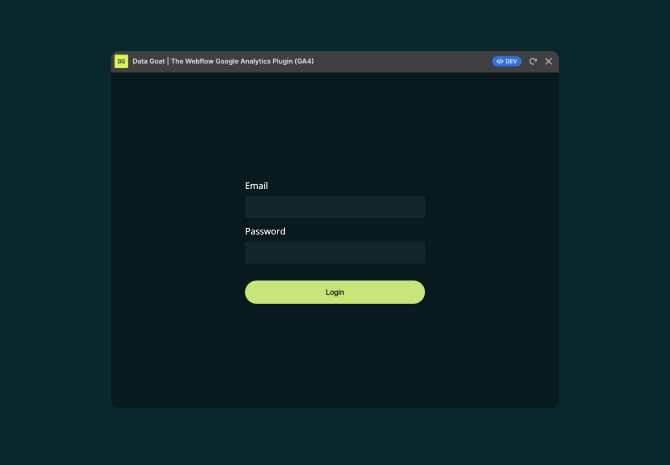
- Step 8: Log in using your Data Goat credentials — Enter your email and password associated with your Data Goat account to access the application within Webflow Designer.
- Step 9: Use the application — Once you have successfully logged in, you can start exploring and using Data Goat's features. Each feature and functionality will be described within the Data Goat interface or documented separately.
Using the Tool in Webflow Designer
After logging in, you’ll see the dashboard displaying data for the selected page. Here’s an overview of all parts of the dashboard.
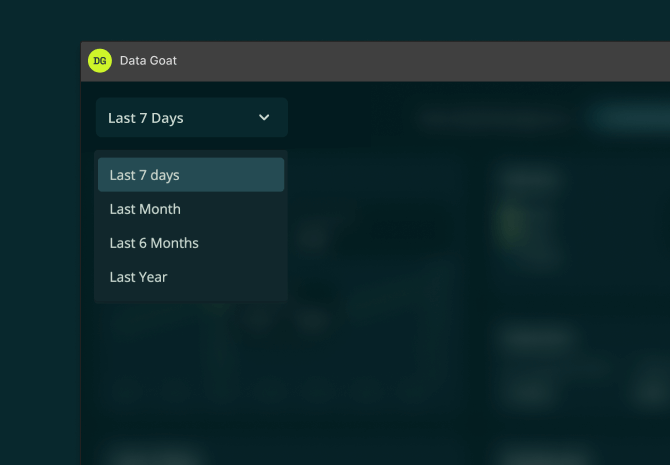
Period Selection
This feature lets you select the previous period you want displayed in the analytics. The available options are:
Current Page/Whole Website
.jpg)
This switch enables you to see the data for the current page only or for your entire website. If you select Current page, you’ll see the link to the page you’re viewing to the left of the switch.
The Visitors Chart
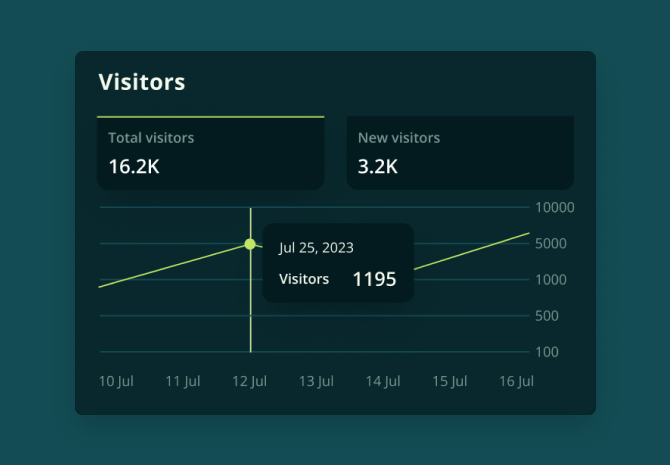
This is where you’ll see the total number of users that visited your website in the selected period and the number of new users who came during that period. You can also see a chart displaying the number of visitors.
Device Metrics
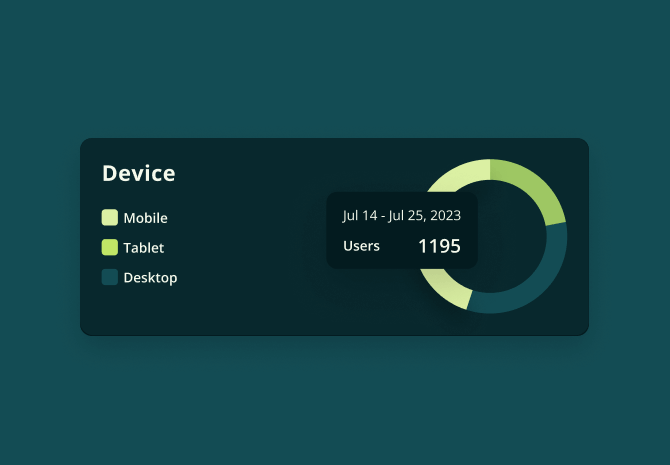
This shows the type of device your traffic is coming from for the selected page and period. You can also hover over the graph to the right for exact numbers.
Sessions Metrics
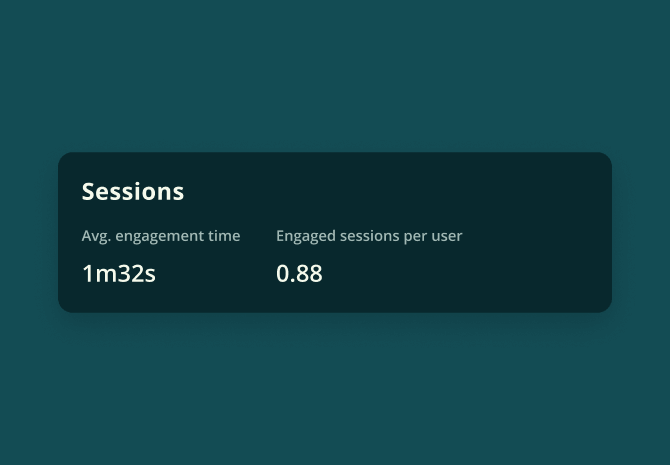
This shows you the average engagement time and the number of engaged sessions per user for the selected period.
Internal Link Clicks
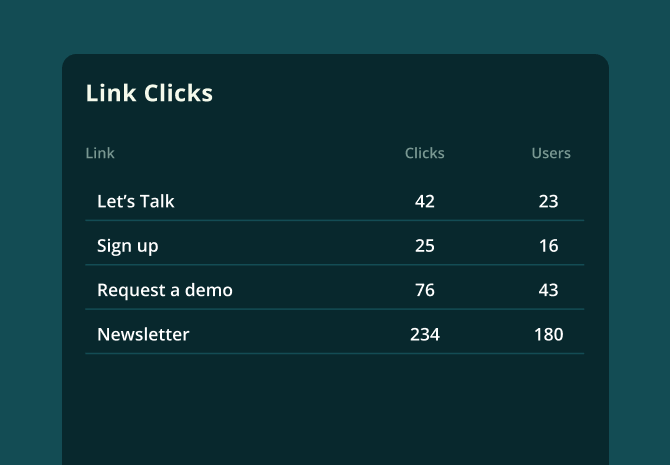
This section shows which internal links the users clicked on the selected page.
Outbound Link Clicks
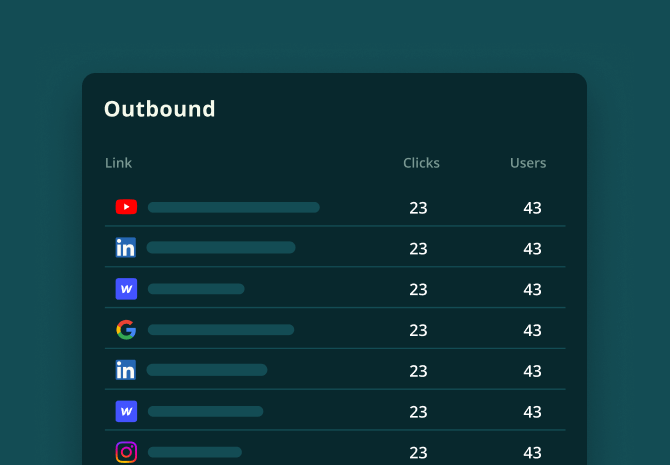
This section shows the outbound links your page visitors are clicking on.
Form Submissions
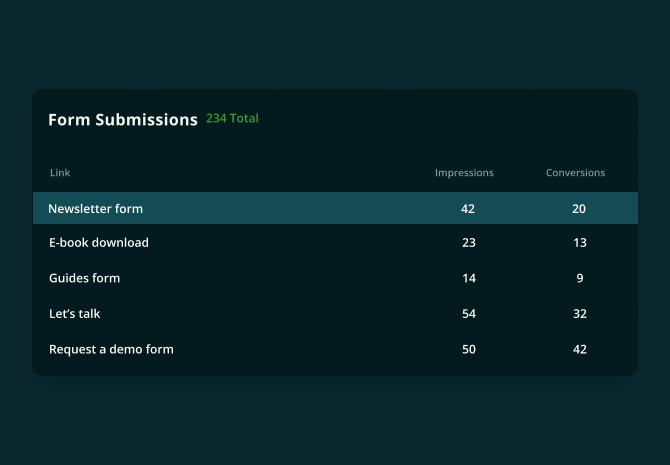
Track form submissions, including the number of form impressions and the actual conversions.
Website Channels
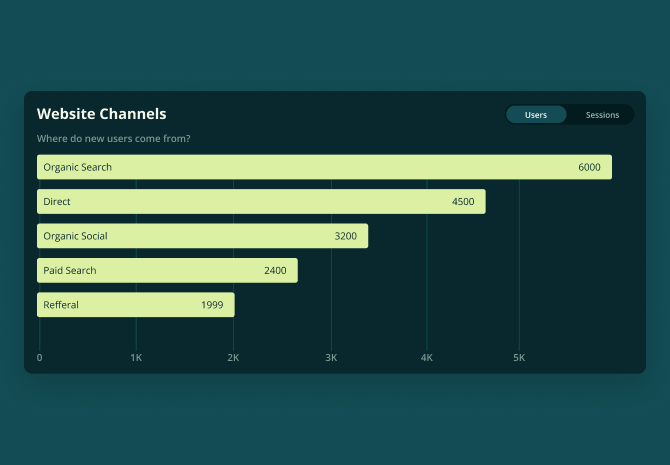
Track the channels through which the traffic comes to your website.
Countries
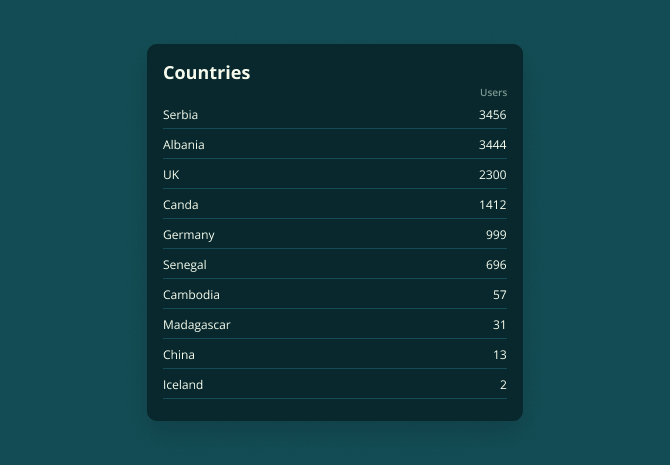
Track which countries your traffic is coming from the most.
Mediums
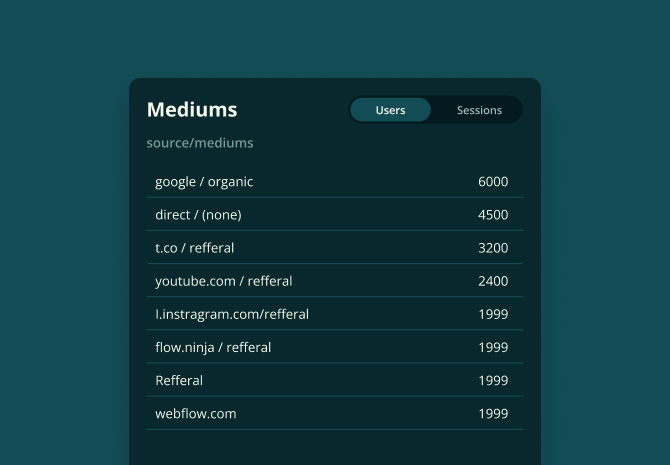
Track the mediums through which the traffic comes to your website or web page.
Page Ranking
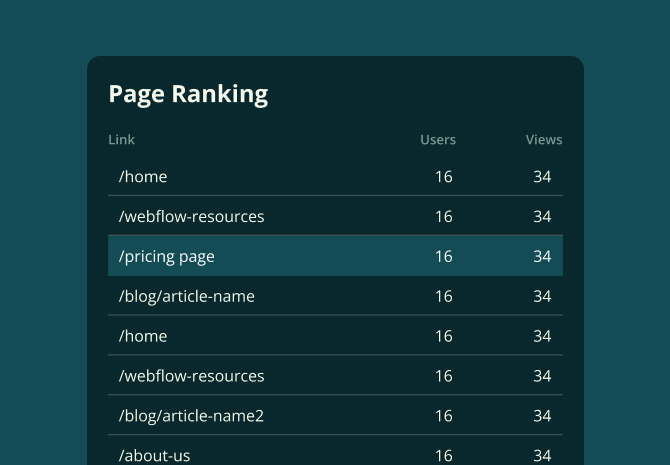
See the most visited pages on your site for the selected period. This is only available with the whole Website view.
Video Tutorials for Using Data Goat
We’re currently working on extensive video tutorials that will help you leverage Data Goat to access actionable insights for your Webflow site.
Troubleshooting and FAQs
Should you encounter any issues related to Data Goat, contact our support team at support@datagoat.com.
Below, we will address some of the frequently asked questions.
What is Data Goat?
Data Goat is a comprehensive analytics tool designed specifically for Webflow users. It seamlessly connects Webflow sites with Google Analytics 4 (GA4), allowing users to track essential metrics, gain insights into user behavior, and optimize their website content.
How do I install Data Goat in my Webflow project?
To install Data Goat, visit the Webflow Marketplace and find the app under Apps → Analytics. Click the "Install" button and select the projects where you want to use Data Goat. Webflow will redirect you to the Data Goat website to complete the registration process.
Is Data Goat suitable for non-technical users?
Absolutely! Data Goat adheres to Webflow's low-code/no-code principles, making it user-friendly and accessible to many users, including developers, designers, marketers, agencies, and companies.
What data can I track with Data Goat?
With Data Goat, you can monitor crucial metrics, including outbound link clicks, site clicks, form submissions, post types, and custom events. It also provides standard analytics such as traffic sources, demographics, and more.
How does Data Goat present data and insights?
Data Goat offers custom report creation, which refines raw data to provide users with relevant analyses tailored to their specific websites and visitors. The tool also provides page-level tracking to offer in-depth insights into individual pages' performance.
Can I connect Data Goat to my existing Google Analytics account?
Yes, you will be prompted to connect Data Goat with your Google Analytics account during the setup process. This allows Data Goat to utilize the data collected by GA4.
Why is data from Google Analytics different from what I see on Data Goat?
Google Analytics sometimes doesn’t show the exact numbers when collecting user data. Instead, it will show you an estimate based on the sample of collected raw data before all data is processed properly. This is referred to as data sampling. Therefore, some discrepancies might exist between Data Goat and Google Analytics. If your Data Goat numbers differ completely from what you see in Google Analytics, please contact our customer support.
Is Data Goat compatible with Webflow Designer?
Yes, Data Goat is a Webflow Designer plugin, meaning it operates entirely within the Webflow environment. There's no need to navigate external platforms, making it convenient for users to access and use the tool directly in Webflow Designer.
How can I access and launch Data Goat within Webflow Designer?
After installing Data Goat and opening your Webflow project in Webflow Designer, go to the sidebar and click on "Apps." Use the search bar to find Data Goat, then launch the app.
Can I track individual pages' performance with Data Goat?
Absolutely! Data Goat allows you to track each website page individually, offering valuable insights into page-specific performance and engagement.
Support and Contact Information
If you want to contact the Data Goat, please fill in the contact form or send an email to support@datagoat.co.
Privacy Policy and Terms of Service
Data Goat is a product by Flow Ninja, thus the Terms of Service and Privacy Policy will be under the Flow Ninja Brand.
You can find these documents on the following links: